Adding custom filter sets
The code now has the functionality to add custom filter response functions, along with the pre-built functionality to use the default filter sets for the five CANDELS fields. To see how this works, let’s load up the module:
[1]:
import dense_basis as db
import os
Starting dense_basis. please wait ~ a minute for the FSPS backend to initialize.
Initialized stellar population with FSPS.
The set of filters is specified by two arguments: filter_list, which is a file that contains a list of filters along with relative paths specifying where the various filters are, and filt_dir, which specifies the absolute directory where the filter_list can be found.
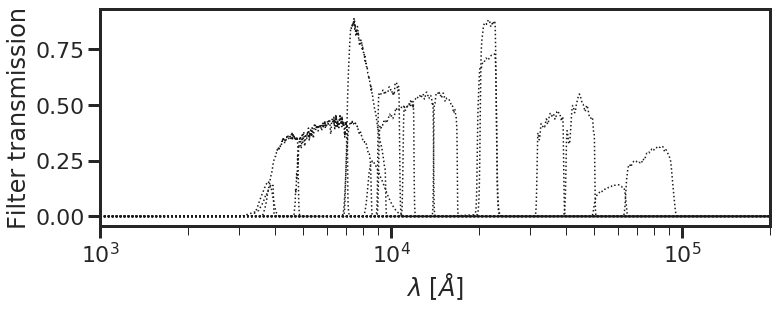
To use one of the default available lists, simply set filt_dir = 'internal', and specify one of the CANDELS fields as shown below. The db.plot_filterset command loads the filters and plots their transmission values as a function of wavelength.
[2]:
filter_list = 'filter_list_goodss.dat'
filt_dir = 'internal' # path to directory containing filter list
db.plot_filterset(filter_list = filter_list, filt_dir = filt_dir)
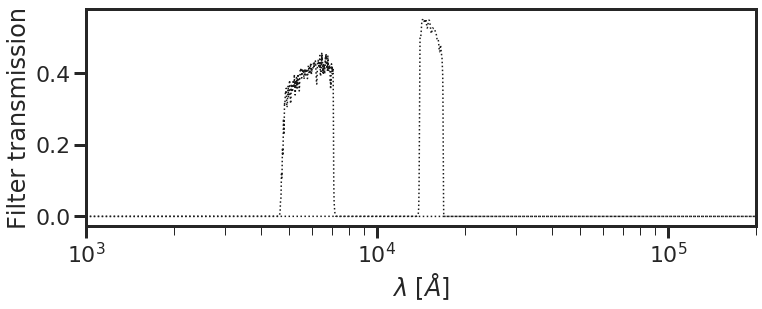
To specify your own custom set of filters and use them in the Dense Basis code, do the following:
- Collect all of your individual filter transmission curves in one place. In the example below, I’m using two filters, named (wfc3_ir_160.txt) and (Filter04_ACS_f606w_2.dat). Both of these files contain a list of wavelengths and their corresponding filter response values that can be downloaded from sites like the SVO filter profile service. Put them in a folder if you’d like. For this example, I’ve kept mine in a folder named (filter_curves) within my working directory.
- Create a
filter_list file. In this case, I made a file in my working directory namedtest_list.dat, containing two lines, each of which specifies the relative path to a single filter:
[ ]:
filter_curves/wfc3_ir_160.txt
filter_curves/Filter04_ACS_f606w_2.dat
- We’re almost done. Now get the absolute path to the working directory (the one containing
test_list.dat) usingdb.get_path. Pass these in as inputs, and plot them to confirm everything is working as expected:
[3]:
filter_list = 'test_list.dat'
filt_dir = db.get_path(filter_list) # path to directory containing filter list
db.plot_filterset(filter_list = filter_list, filt_dir = filt_dir)
[ ]: